Aimagin Analytics พัฒนาสู่ Gen 2 (Go to Gen 2)
Throughout the period of innovation development, Aimagin has produced outstanding software solutions for data analysis and embedded applications to meet the needs of efficient use. One of the software is Aimagin Analytics.
ตลอดระยะเวลาการพัฒนาทางด้านนวัตกรรม บริษัทเอมเมจินได้ผลิตผลงานซอฟต์แวร์ที่โดดเด่นออกมาเพื่อใช้งานทางด้านการวิเคราะห์ข้อมูลและทางด้านระบบสมองกลฝังตัว เพื่อตอบสนองความต้องการการใช้งานให้มีประสิทธิภาพ หนึ่งในซอฟต์แวร์นั้นคือ Aimagin Analytics ซึ่งได้ถูกออกแบบมาเพื่อช่วยให้สามารถวิเคราะห์ข้อมูลได้ง่ายและรวดเร็ว
Aimagin Analytics is designed to enable quick and easy data analysis, the ability to import, change, analyze, and exchange data without the need for specialist data preparation that is different from other Business Intelligent (BI) software. Aimagin analytic is like using a Spreadsheet program to analyze data tables with filters, but we use intellijoin to help join data from many tables automatically into a single table and facilitate users to share information, similar to Dropbox, all working under one suite.
สามารถนำเข้า เปลี่ยนแปลง วิเคราะห์ และแลกเปลี่ยนข้อมูลโดยไม่จำเป็นต้องใช้ผู้เชี่ยวชาญเฉพาะทางในการเตรียมข้อมูลเหมือนซอฟต์แวร์ Business Intelligent(BI) อื่นๆ ซอฟต์แวร์ Aimagin Analytics เปรียบเหมือนการใช้โปรแกรม Spreadsheet ในการวิเคราะห์ตารางข้อมูลด้วย filter แต่ใช้ intellijoin ช่วยในการรวบรวมข้อมูลจากหลายๆ ตารางเข้าด้วยกันเป็นตารางเดียวโดยอัตโนมัติ และอำนวยความสะดวกให้ผู้ใช้งานแบ่งปันข้อมูลกัน คล้าย Dropbox ทั้งหมดนี้ทำงานภายใต้ชุดโปรแกรมเดียว
“Our goal is that anyone who uses Spreadsheet can easily analyze insights and share their results.”
“เป้าหมายของเราคือ ใครที่ใช้ Spreadsheet เป็น ก็สามารถวิเคราะห์ข้อมูลเชิงลึกและแบ่งปันผลการวิเคราะห์ได้ง่าย”
Aimagin Analytics data handling and display
ภาพแสดงการจัดการข้อมูลและการแสดงผลของ Aimagin Analytics
Key Features of Aimagin Analytics Software
1. Convenience to do simple ETL and data cleaning, such as validating the data model with REGEXP, adding data to the JavaScript language, and automatically performing ETL and data cleaning operations.
2. Using the intellijoin technique to automatically combine CSV tabular data from multiple tables (files) together.
3. Load all raw data into RAM of the client machine, allow the client to use the data analysis and display, and limit the role of Server to only File Server. Therefore an inexpensive server can be deployed and allow computational load to be distributed among client machines.
4. Create a variety of Data Visualization in an Online Dashboard style and save cost.
5. Able to share various data files In the system by adding Email to increase teamwork efficiency.
คุณสมบัติเด่นของซอฟต์แวร์ Aimagin Analytics
1. สะดวกในการทำ ETL และ Data Cleaning อย่างง่าย เช่น การตรวจสอบความถูกต้องของรูปแบบข้อมูลด้วย REGEXP, การเพิ่มข้อมูลในรูปแบบภาษา JavaScript และดำเนินการเกี่ยวกับ ETL และ Data Cleaning โดยอัตโนมัติ
2. การใช้เทคนิค IntelliJoin ในการรวมข้อมูลในรูปแบบตาราง CSV จากหลายๆ ตาราง (ไฟล์) เข้าด้วยกันโดยอัตโนมัติ
3. โหลดข้อมูลดิบทั้งหมดเข้า RAM ของเครื่อง Client ที่ทำการวิเคราะห์ข้อมูล ช่วยให้สามารถใช้ Client ในการทำการวิเคราะห์ข้อมูลและแสดงผล และจำกัดบทบาทของ Server เป็นเพียง File Server เท่านั้น ทำให้สามารถใช้ Server ที่ราคาไม่แพงได้ และสามารถกระจายโหลดการประมวลผลไปยัง Client
4. สร้าง Data Visualization ในลักษณะ Online Dashboard ได้เองอย่างหลากหลาย และประหยัดค่าใช้จ่าย
5. สามารถแบ่งปันไฟล์ข้อมูลต่างๆ ในระบบด้วยการเพิ่ม Email เป็นการเพิ่มประสิทธิภาพการทำงานเป็นทีม
 Aimagin Analytics Venn Diagram
ภาพแสดง Venn Diagram ของ Aimagin Analytics
Since the completion of the software development until it was listed on the Thai innovation list by Bureau of the Budget in March 2018, Aimagin has provided services to various customers, and hence, has learnt of more in-depth customer needs, i.e. the needs to support all of data analytics tasks as well as being completely integrated in a single solution package, such as collecting data according to actual workflow or sharing of data that has been collected or analysed, or being able to analyze data at more advanced levels.
ตั้งแต่พัฒนาซอฟต์แวร์เสร็จสมบูรณ์จนกระทั่งได้รับการขึ้นบัญชีนวัตกรรมไทยของสำนักงบประมาณ เมื่อเดือน มี.ค.2561 บริษัทได้ให้บริการกับหน่วยงานต่างๆ เสมอมา ทำให้ทราบถึงความต้องการที่สูงขึ้นอีกระดับหนึ่งของกลุ่มลูกค้า คือต้องการให้ระบบรองรับการทำงานแบบเบ็ดเสร็จ สมบูรณ์ครบวงจรใน Package เดียว เช่น เพิ่มความสามารถใช้รวบรวม บันทึกข้อมูลที่สอดคล้องกับระบบงานจริงด้วย หรือเมื่อรวบรวมข้อมูลหรือได้ผลการวิเคราะห์ข้อมูลแล้วให้สามารถใช้แลกเปลี่ยนกับระบบอื่นๆ ได้โดยอัตโนมัติ อีกทั้งสามารถวิเคราะห์ข้อมูลในขั้นสูงต่อไปได้
Therefore, the company summarized what customers needed and we intended to develop further to create the Generation 2 of data analysis software, Aimagin Analytics.
ดังนั้น บริษัทจึงได้สรุปสิ่งที่ลูกค้าต้องการและพัฒนาต่อจนเกิดเป็นซอฟต์แวร์วิเคราะห์ข้อมูล Aimagin Analytics Generation ที่ 2
Aimagin Analytics 2 System Architecture
ภาพแสดง สถาปัตยกรรมระบบ Aimagin Analytics 2
Aimagin Analytics 2 has capabilities similar to Jupyter Notebook, but there are more improvements. It is a tool set for developing Web applications that can link, exchange, save, manipulate, analyze, process and report statistical, temporal, and spatial data, supports the analysis and processing of both definite structured and unstructured data, GIS data and Big Data data, and supports early processing such as statistical and relational to the application of advanced techniques, such as Artificial Intelligence (AI), Machine Learning (ML) and Deep Learning (DL), all of which are standardized in a single package and have a standardized system management mechanism.
Aimagin Analytics 2 มีความสามารถคล้าย Jupyter Notebook แต่มีการพัฒนาให้มีกลไกเพิ่มเติม คือเป็นชุดเครื่องมือสำหรับพัฒนา Web application ที่สามารถเชื่อมโยง แลกเปลี่ยน บันทึก จัดการ วิเคราะห์ ประมวลผล และรายงานข้อมูลในเชิงสถิติ เชิงเวลา และเชิงพื้นที่ รองรับการวิเคราะห์และประมวลผลทั้งข้อมูลที่มีโครงสร้างแน่นอนและข้อมูลไม่มีโครงสร้างแน่นอน, ข้อมูล GIS และข้อมูล Big Data อีกทั้งรองรับการประมวลผลตั้งแต่ขั้นเริ่มต้น อาทิ เชิงสถิติและเชิงความสัมพันธ์ จนถึงการประยุกต์ใช้เทคนิคขั้นสูง อาทิ Artificial Intelligence (AI), Machine Learning (ML) และ Deep Learning (DL) ซึ่งกระบวนการทั้งหมดนี้ได้ถูกรวบรวมไว้เป็นมาตรฐานเดียวกันภายใน Package เดียว และมีกลไกการจัดการระบบที่เป็นมาตรฐาน
Detecting ships using AI
ภาพแสดงการตรวจพบเรือโดยใช้ AI
Key Features of Aimagin Analytics 2
1. Support ETL and Data Cleaning by using Graphical User Interface technique and writing Custom Python Script. Able to schedule work automatically with the Scheduler system.
2. Automatically link and collect data from all sources in both Structure data (e.g. Database, government system, unsystematic data) and Unstructured data (e.g. Web Scraping from website, data source).
3. Support the creation of Web Applications using Drag and Drop techniques for those who do not have programming skills.
4. Provision of Development Environment where data analysts can independently test data analysis.
5. GIS server and a Web GIS Client that supports processing and display geospatial results, such as supporting Tiling and Zoom level maps, satellite images
คุณสมบัติเด่นของ Aimagin Analytics 2
1. รองรับการทำ ETL และ Data Cleaning ด้วยเทคนิคการใช้ Graphical User Interface และการเขียน Custom Python Script สามารถตั้งเวลาการทำงานโดยอัตโนมัติด้วยระบบ Scheduler ได้
2. เชื่อมโยงและรวบรวมข้อมูลจากทุกแหล่งข้อมูลแบบอัตโนมัติ ทั้งข้อมูลแบบ Structure (เช่น Database ระบบภาครัฐ, ข้อมูลที่ยังไม่มีระบบ) และแบบ Unstructure (เช่น Web Scraping จาก Website แหล่งข้อมูล)
3. มีระบบรองรับการสร้าง Web Application ด้วยเทคนิค Drag and Drop สำหรับผู้ที่ไม่มีทักษะการเขียนโปรแกรม
4. มี Development Environment ที่นักวิเคราะห์ข้อมูลสามารถทดสอบการวิเคราะห์ข้อมูลได้อิสระ
5. มี GIS server และ Web GIS Client ที่รองรับการประมวลผล และแสดงผลด้านภูมิสารสนเทศ เช่น รองรับการทำ Tiling และ Zoom level แผนที่ภาพถ่ายดาวเทียม
Sentinel Map
ภาพแสดงแผนที่ Sentinel
6. OLTP SQL Database that supports transaction data storage for analysis and processing, efficient time retrieval and database change monitoring.
7. OLAP SQL Database that supports analysis and processing of large data, in particular, making it possible to analyze data very fast.
8. Support data compression to reduce storage size and support distributed query and automatic data replication between multiple servers to increase system reliability.
9. Software Development Kit Module that contains SDKs and APIs. SDKs support creating Web Applications and APIs to communicate with each other in each module.
6. มี OLTP SQL Database ที่รองรับการใช้งานเพื่อเก็บข้อมูล Transactions ต่างๆ เพื่อนำไปวิเคราะห์ประมวลผล สามารถเรียกข้อมูลในเชิงเวลาและการตรวจสอบการเปลี่ยนแปลงของฐานข้อมูลได้อย่างมีประสิทธิภาพ
7. มี OLAP SQL Database ที่รองรับการวิเคราะห์ประมวลผลข้อมูลขนาดใหญ่โดยเฉพาะ ทำให้สามารถวิเคราะห์ได้รวดเร็ว
8. รองรับการบีบอัดข้อมูลเพื่อลดขนาดพื้นที่จัดเก็บข้อมูลและรองรับการทำ Distributed query และการทำ Duplicate ระหว่างหลายๆ Server โดยอัตโนมัติ เพื่อเพิ่มความมั่นใจในระบบ
9. มี Software Development Kit Module ที่ภายในประกอบด้วย SDK และ API SDK รองรับการสร้าง Web Application และมี API ช่วยติดต่อสื่อสารกันในแต่ละ Module
Comparison table of Aimagin Analytics and Aimagin Analytics 2 capabilities
| Aimagin Analytics | Aimagin Analytics 2 |
Information Types | Only structure data - File base: CSV, Excel | Structure data
Unstructured data
|
Cleaning Data |
|
|
Data Processing | ||
Processor |
|
|
Data Size |
|
|
Data Analysis Algorithm Development |
|
|
Data playground |
|
|
User Interface | ||
Able to create User Interface |
|
|
How to create User interface |
|
|
Dynamic Behaviour for User Interface |
|
|
Management System |
|
|
User Management |
|
|
ตารางเปรียบเทียบขีดความสามารถของ Aimagin Analytics และ Aimagin Analytics 2
| Aimagin Analytics | Aimagin Analytics 2 |
ประเภทข้อมูล | เฉพาะ Structure data เท่านั้น - File base: CSV, Excel | Structure data
Unstructured data
|
ด้านการทำความสะอาดข้อมูล |
|
|
ด้านการประมวลผลข้อมูล | ||
หน่วยประมวลผล |
|
|
ขนาดข้อมูล |
|
|
การพัฒนาอัลกอริทึมวิเคราะห์ข้อมูล |
|
|
Data playground |
|
|
ด้าน User Interface | ||
User Interface ที่สร้างได้ |
|
|
วิธีสร้าง User interface |
|
|
การกำหนดพฤติกรรมของ User interface |
|
|
ด้านการจัดการระบบ |
|
|
ด้านการจัดการผู้ใช้งาน |
|
|
Although Aimagin Analytics 2 has much improved system capabilities to meet the customers' needs, we will not stop inventing and developing new innovations such that our software can compete internationally and be the first choice that customers think of when trying to solve problems.
ถึงแม้ Aimagin Analytics 2 จะพัฒนาขีดความสามารถของระบบให้สามารถตอบสนองต่อความต้องการของลูกค้าได้ครอบคลุมทุกด้าน แต่เราจะไม่หยุดคิดค้นและพัฒนานวัตกรรมใหม่ๆ เพื่อหวังให้ซอฟต์แวร์ของเราสามารถแข่งขันได้ในระดับสากลและเป็นตัวเลือกแรกที่ลูกค้านึกถึงในการจัดการแก้ไขปัญหาในการทำงาน


Recent Posts
-
 Aimagin IoT Solution
-
 Aimagin Analytics KPI - แนะนำระบบติดตามและประเมินตัวชี้วัด (KPI)
-
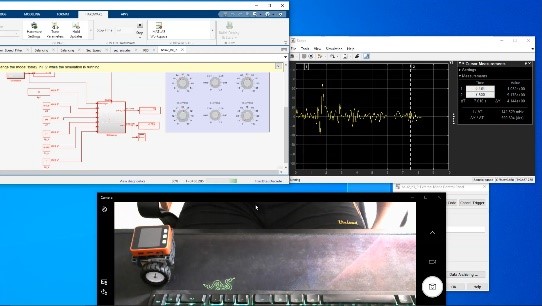 Internet of Things (IoT) Feedback Control with Model-Based Design and Waijung 2 for ESP32 Workshop (Balancing robot controller project-based learning)
-
 Internet of Things (IoT) Feedback Control with Model-Based Design and Waijung 2 for ESP32 Workshop (RC-circuit controller project-based learning)
-
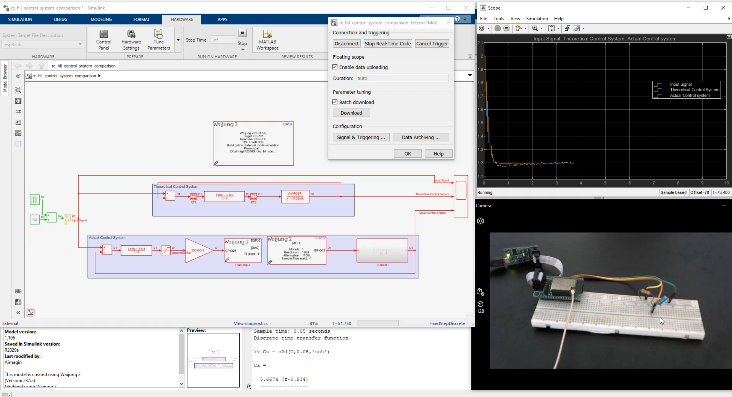
 Project 1B "Deploying Simulink and State flow to ESP32 using Waijung 2"